
Philadelphia’s Big-Box Distribution-Warehouse Oversupply
I’ll get to the larger numbers and math details shortly, but before I do, I’ll put the market into visual context with the building in this video clip, which is slightly under 500,000 square feet:
There are the equivalent of 41 of these buildings (constructed after 2015) and currently under construction available for lease.
There are the equivalent of another 55 of these buildings (constructed prior to 2015) also available for lease.
Looking in the rear view on how we got here is interesting and multifaceted, but the current focus will be more centered around what lies ahead for Greater Philly’s big-box industrial market, specifically how long is it going to take to lease up 20 MIllion* square feet?
20 Million represents:
15 Million square feet of existing Class A big-box warehouse-distribution spaces, constructed after 2015, in spaces/buildings >100,000 square currently listed as available for lease.
5 Million square feet are currently under construction and listed as available for lease.
Next up, Modernized Class A along with Class B and C buildings constructed before 2015, in spaces/buildings >100,000 square feet, currently have another ~26.7 Million square feet listed as available for lease.
This tallies up to 46.5 Million square feet in 169 buildings of big-box warehouse-distribution space currently on the market listed as available for lease in Philadelphia, Bucks, Montgomery, Delaware, Chester Counties, PA + Burlington, Camden, Gloucester Counties, NJ. The size of spaces on the market in all three categories resemble bell curves with the most number of spaces sitting in the 150,000-500,000 square foot range.

Phila Big Box Industrial Supply
Capture, Not Absorption
The overall size of the market or total inventory is irrelevant for this analysis because the vacant square feet of supply number is jarring enough to assess in and of itself without the clutter of stats like total market inventory and market-wide vacancy rates.Those metrics are only useful at the submarket and micro-market levels.
Even though some of the vacant big-box will get lured from current locations if their leases expire in theory, this result is not automatic considering the cost to move- occupiers have enough uncertainty in their core businesses. Moving will not be optimal, landlords don’t want to lose tenants and new deals will require sizable concessions from owners of the vacant boxes.
With this much quantity, absorption also becomes an inadequate gauge and doesn’t fully take into account other market dynamics. Capture needs to be taken into account. Capture isn’t a made up metric, it’s just more difficult to calculate, requires explanation and therefore not talked about in most of the market commentary. Cushman & Wakefield industrial research discusses and specifically quantifies absorption capture skewing to newly built stock in recent years, recognizing tenant demand for and preference to an influx of new space that has come online since 2020. CBRE industrial market reports discuss tenant segment capture.
But for me, it’s due to this activity that capture emerges from a scantily discussed concept to a necessary model to cleanly quantify and understand market supply. Especially in the last 5 years, a deeper look is required given the amount of capital investment that has come into this space as an asset class in not just the last 5 years, but now 10+. It’s not just new buildings being built, capital is also allocated to renovating well-located Class B and C space. Many of the most active tenants, 3PLs, retailer distribution, e-commerce fulfillment seek 36’ clear, truck courts with circulation, more trailer parking, heavier power capacity, and other specifications that lend itself to maximum throughput.
Circa 2015 is when the design standard changes for new build-to-suit and spec product began popping up in submarkets across the country. Therefore, my analysis takes into account not only the last 3-5 years. My pre-post year is 2015, a time when new construction ramped, but so did renovation and modernization of existing buildings to updated design standards.
Pre-2015 construction big-box “shadow-inventory” isn’t automatically obsolete. Many developers were able to timely acquire B-C older vintage bricks in last-mile locations for a good basis before the market overheated, inject new-industry-standard capex upgrades and beat the new construction market on time to market, lease rates and location.
Now that we’ve established the significance of the 26.7 MSF of pre-2015 “shadow inventory”, it is now possible to use different capture scenarios to calculate lease-up runway periods if this stock continues to siphon away demand from the 20 MSF of existing (post-2015) and currently under construction big-box industrial.
Recognizing a construction pipeline reduction, with *only* 5 MSF under construction, capture remains the key to projecting how long the leasing runway is for the market to absorb this available space. If anything, pipeline reduction will eventually help more with respect to owner pricing power. With this quantity of existing stock, closing off the pipeline will have limited obvious upside impacts in the near term.
Market activity will have to come from tenant and occupier demand. Upcoming quarterly corporate earnings calls in the logistics, retail, e-commerce, transport and manufacturing sectors should offer new clues on forward-looking industrial real estate leasing demand. According to Costar for example, demand is already shifting with large logistics occupiers placing a priority on space optimization.

Industrial Big Box ZVintage Capture Rate Impacts on Lease-Up Runway Years
Lease-up Math
In order to project lease-up time runways based on current availability, it is necessary to establish a forward average annual market-wide absorption assumption to complete the analysis. My Costar research resulted in roughly 4 Million square feet average annual absorption for the last 5 years, in other market reports I’ve seen ranges of 5 MSF-8MSF annually. Post-pandemic saw 10 MSF + years.
So to make the math simpler and smooth out ranges, let’s assume a forward-looking market-wide absorption of 5 MSF. This is notoriosly a wide and unreliable data point, especially at the market/regional level. 5 MSF is a market-wide assumption as a starting point, for all buildings/spaces measuring >100,000 square feet regardless of construction vintage.
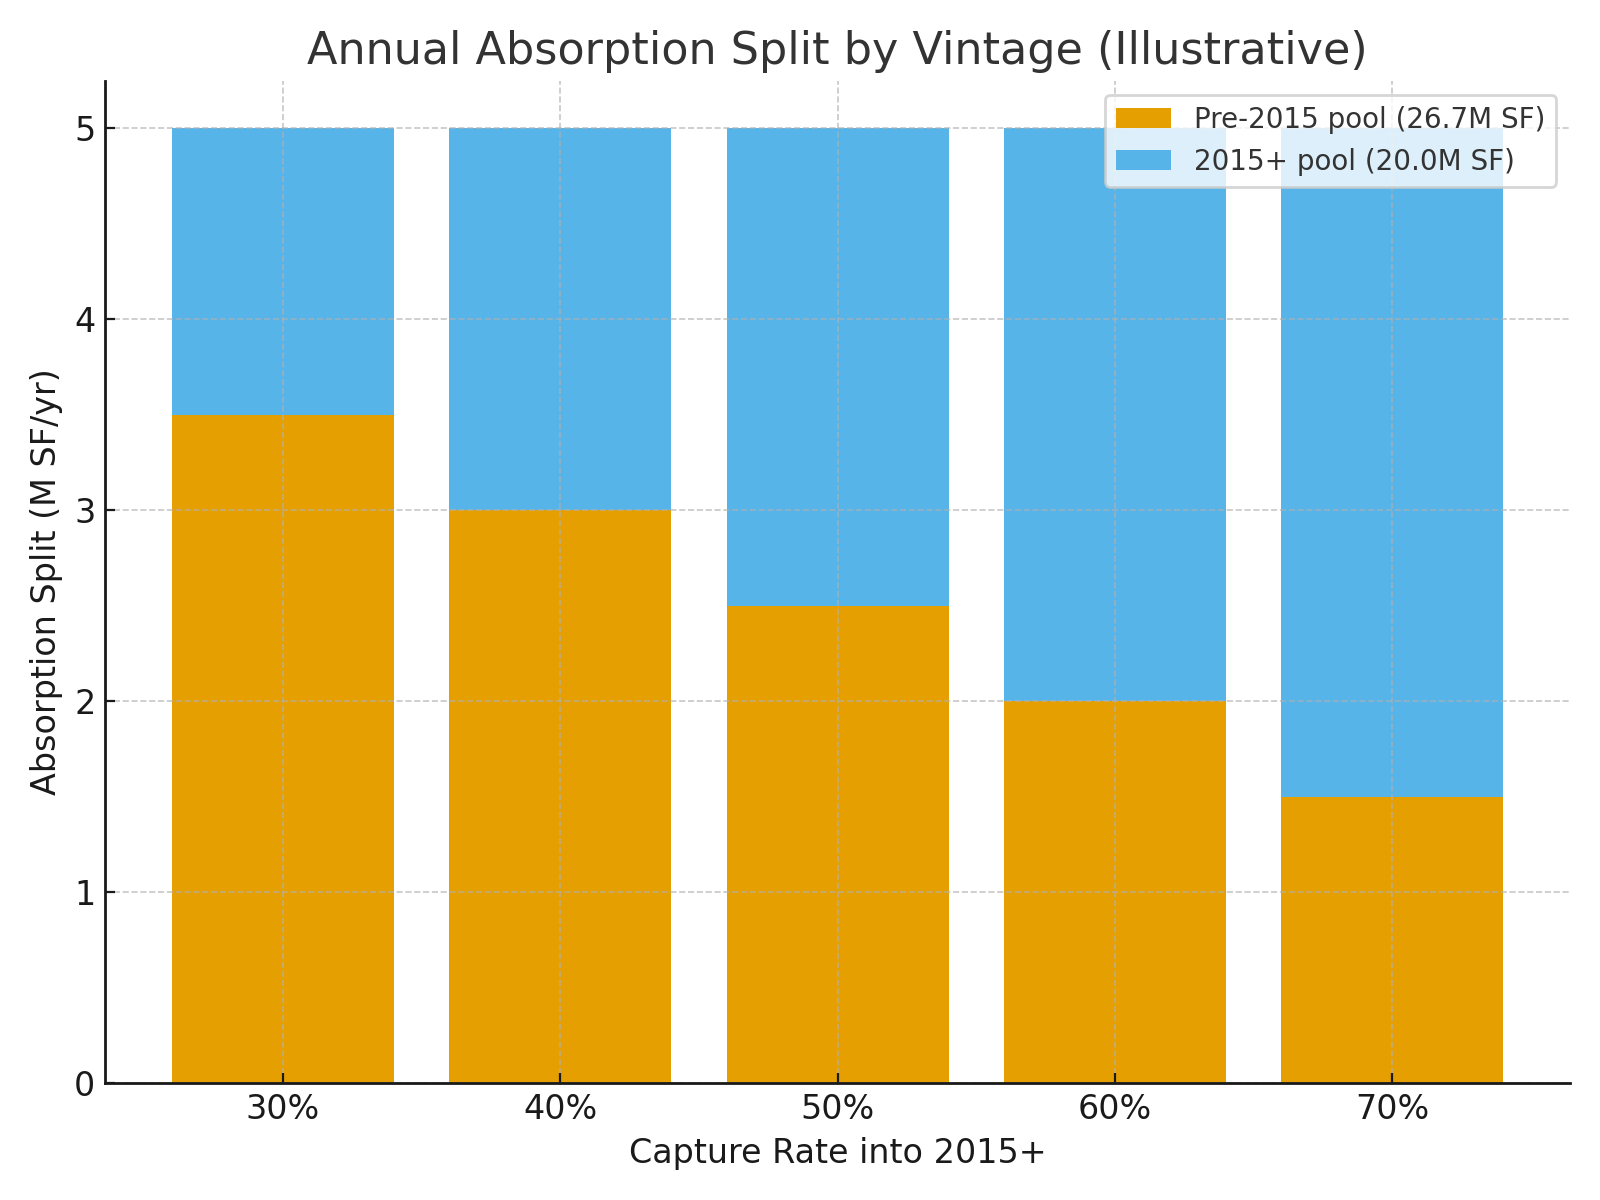
From there, I’ll reintroduce the pre-post 2015 construction vintage into the equation and assume since the overall preference is for new space, and the fact that there is so much of it, the capture rate for post-2015 construction is 60%. That is, 60% of the 5 MSF (3 MSF) demand will flow into the post-2015 construction segment and 40% (2 MSF) will flow into the lower-priced, pre-2015 construction segment.
So, if there are 15 MSF of existing post-2015 available for lease and 5 MSF under construction, that’s 20 MSF total for post-2015 construction supply. 20 MSF divided by the 3 MSF per year that flows into post-2015 construction product bucket results in approximately 7 years of lease-up time.
What if you flip the pre-post 2015 share and because there is such a deep stock of pre-2015 space tenants’ can occupy at a lower lease rate. Assume that tenants will generally be more price sensitive in an uncertain import/export environment. Then, 40% (2 MSF) flow into post-2015 would yield a 10 year lease-up runway for the newer vintage supply.
This example calculation illustrates the importance of asset vintage capture, the various assumptions that are required to even begin to put meaning behind headlines that come out on ‘millions of square feet’, ‘peak vacancy’, ‘new supply cliffs’ and ‘market absorption’.
Modifications of input assumptions are best illustrated visually where 10% capture rate fluctuations result in 2-3 years swings in lease-up runway and, therefore, the timeline developers and investors should be calculating when making big-box investment decisions in this market and other oversupplied markets around the country.
Other factors that could impact lease-up time of post-2015 vintage space include lease concession packages and demising space to smaller bays.
Absorption Vintage Splits and Capture Rate Sensitivity
Market Forces
One of the beauties of industrial real estate is it’s the least visible and understood property asset class, but the most dependent on intertwined macro market forces, specific feeder industries that use and occupy the space and the least insulated from global market geopolitical shocks.
Even if Philadelphia was overbuilt, prior to this year there may have already been slowing leasing volume coming off of a couple of massive years, however, it was still positive trends for global trade. With April 2, 2025 tariffs announced, it really couldn’t have come at a worse time for the big box industrial real estate market which requires growth in everything from global trade imports and exports to domestic manufacturing.
On top of that, and while this conversation is about big-box distribution-warehouse real estate, other industrial sectors like manufacturing- and really infrastructure manufacturing, much of it coming from green sectors and automobiles industry, momentum is also stripped away from the industrial complex. The manufacturing segment of the market is heavily dependent on importing project equipment and materials and in turn in need of warehouse and yard space.
So while there are other reasons to be optimistic about the industrial complex, trade and infrastructure project reductions and uncertainties are not two of them.
The big box market is relatively fresh off of 10+ MSF lease absorption years post-Covid. So it is possible with market catalysts for absorption to spike to 10+ MSF and maybe the forward annual absorption rate is not 5 MSF, it’s higher for whatever combination of reasons, resulting in fewer lease-up runway years. For an opposite combination of reasons, market leasing activity could very well underperform trended averages in the coming years resulting in longer lease-up runway years.
But as an owner-operator-developer assessing a market with high lease availabilities, it is necessary to bifurcate the market to pre-post 2015 as well as strip out small bay <100,000 square foot spaces/buildings and model capture scenarios in order to identify irrelevant demand.
From there, market participants can make better decisions on how to proceed and what opportunities to pursue armed with both upside and downside scenarios for digesting the excess distribution-warehouse real estate in the Philadelphia metro area.